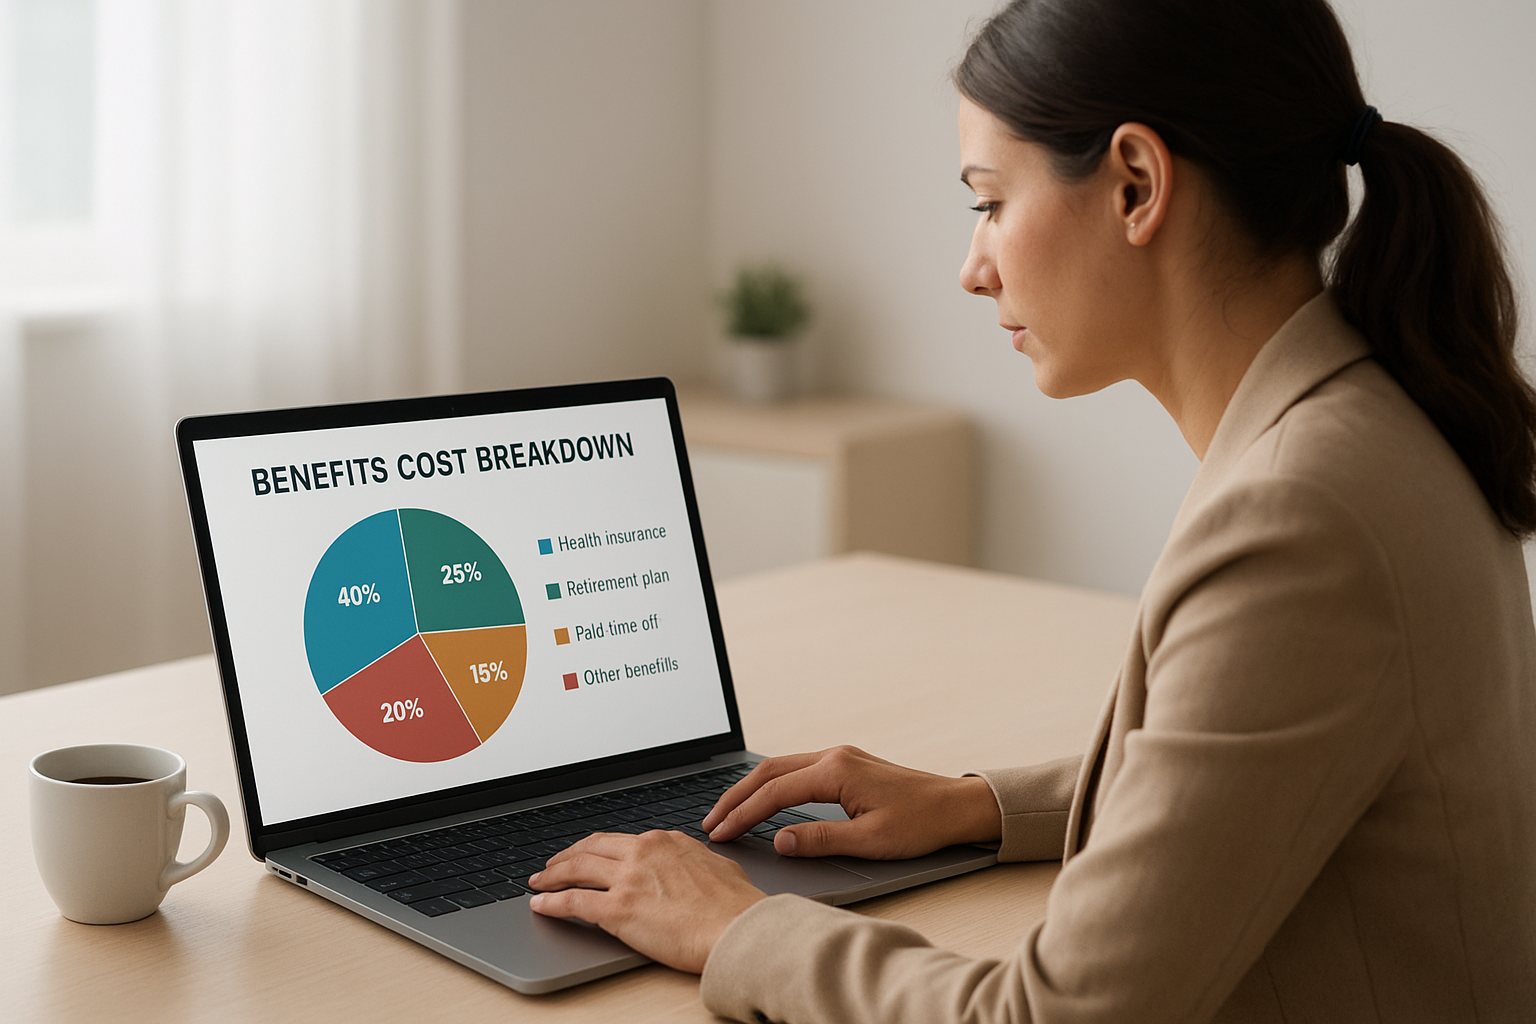
The average cost of benefits per employee is one of the first numbers a growing company needs to nail down before adding headcount or negotiating a new health plan. In plain terms, the average cost of benefits per employee is the total amount an employer spends on non-wage compensation—things like health insurance, retirement contributions, and paid leave—divided by the number of employees, usually shown as an annual dollar figure or a percentage of payroll. For most small and mid-sized businesses, that figure lands between $12,000 and $18,000 per employee each year, though it swings widely by industry, location, and plan design.
In addition, this number matters far beyond payroll math. It shapes hiring budgets, influences retention, and often determines whether a company can compete for talent against larger organizations. Therefore, understanding what drives this cost—and how to manage it—is essential for any leader building a sustainable HR strategy.
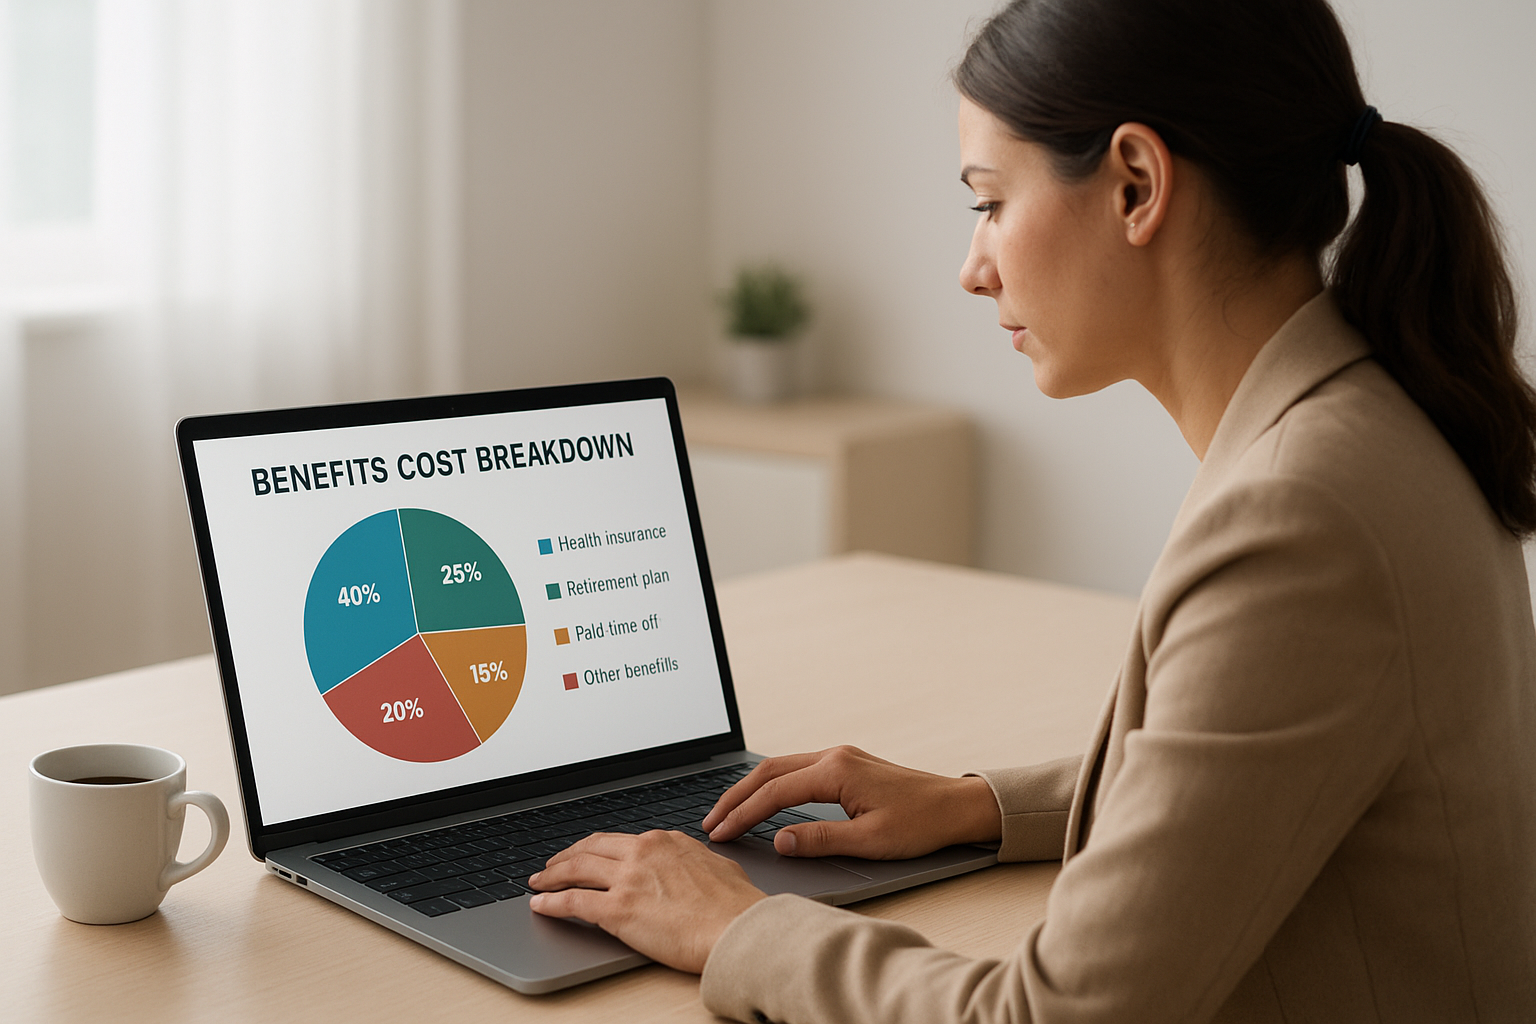
Understanding the average cost of benefits per employee helps HR leaders budget with confidence.
What Is the Average Cost of Benefits Per Employee?
The average cost of benefits per employee is the total dollar value an organization spends on employee benefits, divided by its headcount, over a defined period—usually one year. This figure typically includes health insurance, retirement plan contributions, paid time off, and mandatory employer-paid taxes like Social Security and unemployment insurance.
According to the U.S. Bureau of Labor Statistics’ Employer Costs for Employee Compensation report, benefits consistently make up roughly 29% to 31% of total compensation costs for civilian workers. Consequently, benefits are not a minor line item—they represent nearly a third of what it actually costs to employ someone.
For a deeper walk-through of how to run these numbers for your own team, see this cost of benefits per employee calculator guide, which breaks the math down step by step.
How Much Do Employers Spend on Benefits Per Worker?
Spending patterns vary considerably depending on company size and industry. Small businesses with fewer than 50 employees often spend less per person on benefits simply because they have less negotiating leverage with insurance carriers. Larger employers, in contrast, can pool risk across more people and typically secure better group rates.
For example, professional services and tech firms often spend at the higher end—sometimes exceeding $18,000 annually per employee—because they compete aggressively for skilled talent. Meanwhile, industries like human services or light manufacturing may spend less on premium benefits but more on required compliance-related costs such as workers’ compensation.
If you want a full breakdown of how base pay and benefits combine into total employer cost, this resource on employer costs for employee compensation explains the components clearly.
Key Factors That Influence Benefits Costs for Employees
Several variables push the average cost of benefits per employee up or down. First, geography plays a major role, since healthcare costs and minimum wage laws differ by state. Second, workforce age and family status affect insurance claims and premium pricing. Third, the richness of the benefits package—such as offering dental, vision, and disability coverage versus just basic health insurance—directly changes the total spend.
Company size also matters. Specifically, smaller employers often pay a higher per-person rate for the same coverage because they lack the bargaining power of larger groups. However, joining a PEO (professional employer organization) or benefits consortium can help level that playing field.
Finally, plan design choices—like deductible levels, employer contribution percentages, and whether the company self-funds insurance—all shift the final number. As a result, two companies of similar size in the same city can have wildly different benefits costs depending on these design decisions.
Quick Insight: Health insurance alone typically accounts for over half of total benefits spending, making it the single most important line item to manage carefully.
Breaking Down the Cost of Employee Benefits by Category
To make the average cost of benefits per employee easier to understand, it helps to see where the money typically goes. Below is a general breakdown based on common employer spending patterns:
- Health, dental, and vision insurance: Usually 50% to 60% of total benefits spend.
- Retirement contributions: Typically 10% to 15%, including 401(k) matches.
- Paid time off and leave: Roughly 15% to 20%, covering vacation, sick leave, and holidays.
- Legally required benefits: Around 8% to 10%, including Social Security, Medicare, and unemployment insurance.
- Other perks: The remainder covers items like life insurance, disability coverage, or wellness stipends.
For a closer look at how each benefit type factors into a competitive package, check out this guide to the types of employee benefits most companies offer today.
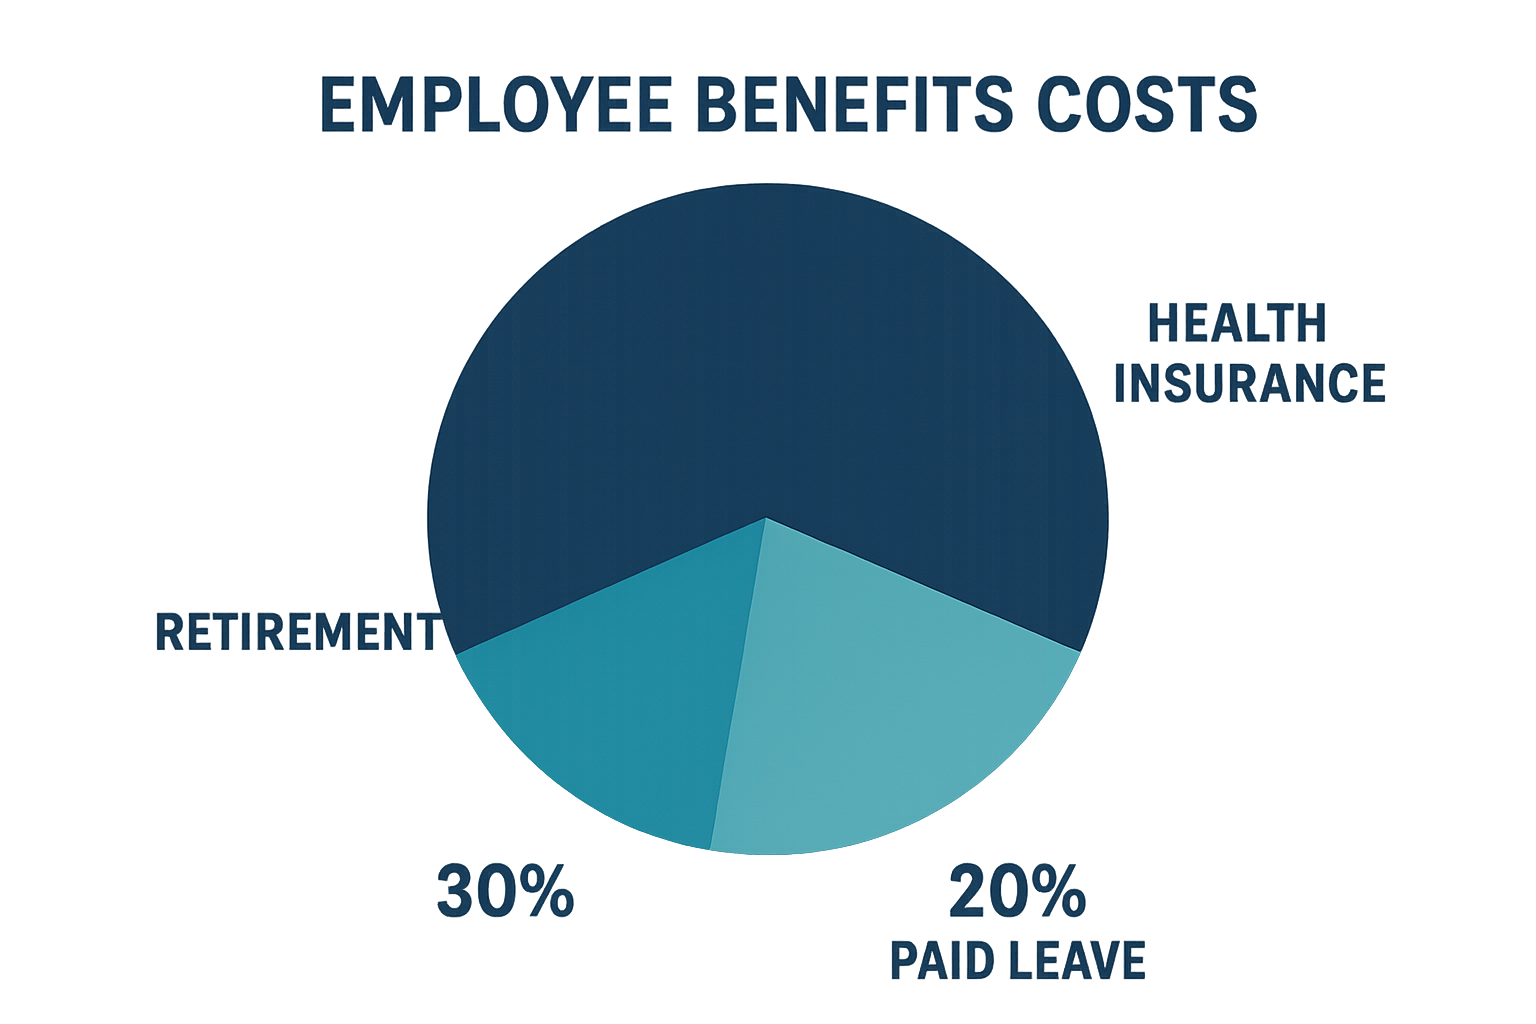
A visual breakdown helps put the average cost of benefits per employee into perspective by category.
How to Calculate Your Own Cost Per Employee for Benefits
Calculating your specific cost per employee for benefits does not require a finance degree. Instead, follow these four steps to arrive at a reliable, usable number for budgeting and benchmarking purposes.
- Add up total annual benefits spending, including every premium, contribution, and employer-paid tax tied to those benefits across the whole year.
- Count your total number of benefits-eligible employees, since only workers who actually receive coverage should be included in this figure.
- Divide your total annual benefits spending by the number of eligible employees to produce your company’s average cost of benefits per employee.
- Compare the result to industry benchmarks, such as data published by the Bureau of Labor Statistics, to see whether your spending is competitive.
Above all, repeat this calculation every year, since premium increases and headcount changes can shift the number significantly even without changing your plan design.
Tips to Manage Rising Benefits Costs Without Sacrificing Quality
Rising healthcare costs mean the average cost of benefits per employee will likely keep climbing in the years ahead. However, that does not mean quality has to suffer. In particular, offering tiered plan options lets employees choose coverage that fits their needs and budget, which can lower overall employer spend without cutting access.
Similarly, partnering with a PEO or outsourced HR provider often unlocks better group rates than a small business could secure alone. In contrast, trying to manage benefits entirely in-house without dedicated expertise frequently leads to overpaying for coverage employees do not use.
For a practical framework on building a plan that balances cost and competitiveness, see this guide on creating competitive employee benefits packages. Additionally, this comparison of employee benefits providers for small businesses can help narrow down the right carrier fit.
Learn more about how Soteria HR partners with growing companies to design cost-effective benefits programs by visiting Soteria HR directly.
Frequently Asked Questions About Average Cost of Benefits Per Employee
What is the average cost of benefits per employee in 2026?
The average cost of benefits per employee typically runs between $12,000 and $18,000 per year for full-time workers, depending on industry, company size, and plan design. This usually represents 25% to 40% of an employee’s total compensation package.
How is the cost of employee benefits calculated?
Employers add up all benefits spending, including insurance premiums, retirement matches, paid leave, and payroll taxes, then divide that total by headcount. The result can be shown as a dollar figure or as a percentage of payroll.
What percentage of payroll should go toward employee benefits?
Most small and mid-sized businesses budget 25% to 35% of total payroll for benefits. Companies competing for specialized talent, such as tech firms, often lean closer to the higher end of that range.
Why do employee benefits costs vary by industry?
Benefits costs vary because industries differ in required coverage, workforce demographics, and how fiercely they compete for talent. As a result, a tech company and a manufacturing firm can have very different benefits budgets even with similar headcounts.
What benefits cost the most for small businesses?
Health insurance is consistently the largest single expense within any benefits package, followed by retirement contributions and paid time off. Together, these three categories typically make up the majority of total benefits spending.
How can small businesses lower the cost of employee benefits?
Small businesses can lower costs by joining a PEO or benefits consortium, offering tiered plan options, and benchmarking rates every year. Working with an experienced HR partner to negotiate carrier contracts also helps control costs over time.
Is health insurance the biggest driver of benefits costs?
Yes, health insurance is generally the single biggest driver of the average cost of benefits per employee. Premiums have risen faster than general inflation for years, keeping it at the top of most benefits budgets.
How often should employers review their benefits costs?
Employers should review benefits costs at least once a year, ideally ahead of renewal or open enrollment season. Fast-growing companies may benefit from quarterly check-ins instead.
What is the difference between total compensation and base salary?
Base salary refers only to wages, while total compensation includes salary plus the dollar value of benefits, bonuses, and employer-paid taxes. Looking at total compensation gives a more accurate picture of what a role truly costs.
Do part-time employees affect the average cost of benefits per employee?
Yes, part-time employees usually lower the blended average because they often receive prorated or no benefits. However, certain state laws can require minimum coverage even for part-time staff, which shifts the average upward.
What common mistakes increase employee benefits costs?
Common mistakes include failing to shop plans annually, offering a one-size-fits-all package, and not tracking actual utilization data. Consequently, many companies overpay for coverage employees never use.
How does Soteria HR help companies manage benefits costs?
Soteria HR helps growing companies design and manage competitive, cost-effective benefits programs tailored to their stage of growth. This includes plan benchmarking, carrier negotiation support, and ongoing compliance monitoring that prevents costly surprises.
Bringing It All Together
Ultimately, the average cost of benefits per employee is a moving target shaped by industry, company size, and the specific mix of coverage offered. However, understanding the categories that drive spending—health insurance, retirement, paid leave, and required taxes—gives leaders a clear starting point for smarter budgeting.
In addition, comparing your own numbers against trusted benchmarks, such as those tracked by the Bureau of Labor Statistics or industry groups like SHRM, helps ensure your benefits spend stays competitive without overshooting budget. For further background on how benefits fit into broader compensation strategy, the Wikipedia overview of employee benefits offers helpful historical context.
Above all, growing companies do not need a full internal HR department to get this right. With the right partner monitoring plan performance, compliance, and cost trends, leaders can offer benefits that attract great people—without losing sleep over the budget.